Work
AI at Visma Flyt
2025 to now · Lead AI Engineer, then AI Tech Lead
The role. I lead the AI Hub, the team that builds the AI services in the software Visma Flyt makes for Norwegian municipalities. A lot of the job sits outside the team:
- I help drive Visma Flyt's AI adoption, and run Claude workshops with managers and with the legal team.
- I lead a project moving user-facing documentation into GitHub next to the code, so AI can help keep it up to date as the code changes.
- I sit in the product leadership group, and take part in budgeting, tenders and customer meetings.
I was tech lead and hands-on developer on the first services, and I'm still hands-on across the stack. Visma Flyt's blog interviewed the new team in March 2025 (in Norwegian).
The services. Two are in production with municipalities, past the pilot stage, and a third is rolling out:
- Document field extraction suggests the key details in incoming documents, for staff to check.
- Transcription turns audio into text.
- An AI assistant inside the products, rolling out across them.
Some have demos on Visma Flyt's AI page (in Norwegian). Municipal data is sensitive: the services are hosted in the EU, and I led and coordinated their approval under Visma's secure cloud-delivery framework, which brings them under ISO 27001 and ISAE 3402 Type 2. They are built for GDPR, the EU AI Act and Norway's coming AI act.

The AI services suggest; staff check and decide.
Stack. Python and TypeScript on Azure, with infrastructure as code.
Visma Resolve
2020 to 2025 · AI Specialist
Forecasting, optimisation and, later, large language models.
- Sales forecasting and inventory optimisation. I was lead engineer and ML expert on a service that forecasts retail sales and suggests how much stock to keep.
- An LLM assistant for legal advisors. I led the implementation.
- School timetabling. I managed and developed a timetabling service and doubled its usage.
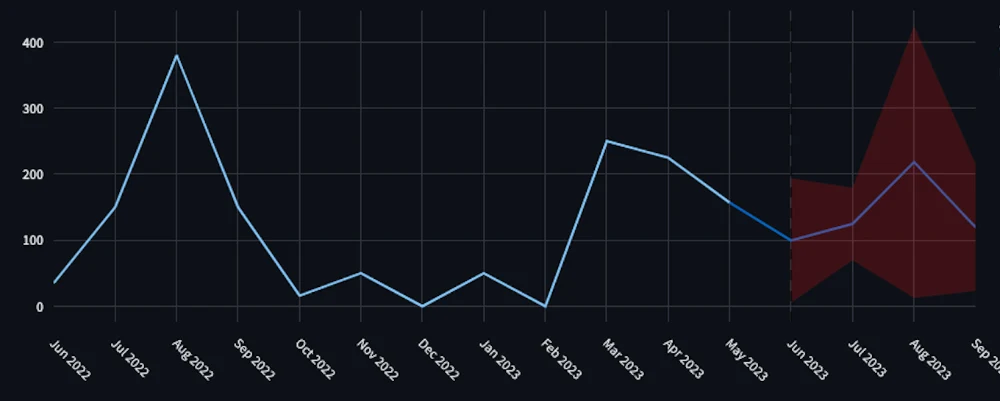
A demo of the forecasting service: sales history, then a forecast with its prediction interval.
Smaller explorations included suggesting time registrations for project workers, working out whether a sole proprietorship should become a limited company, and sorting calendar events with language-model embeddings and clustering.
I also ran hands-on workshops with students, such as a forecasting competition and one building a genetic algorithm for vehicle routing.
Tracking rock layers in seismic data
2019 to 2020 · RagnaRock Geo and NTNU
Seismic surveys show the layers of rock below the ground, and interpreting them means tracing the boundaries between layers through large 3D volumes. By hand, that is slow. I worked on automating it from two directions:
- With deep learning, as a part-time data scientist at RagnaRock Geo in 2019, building computer vision systems.
- With explainable statistics, in my master's thesis in applied mathematics at NTNU: hidden Markov models that track those boundaries through the volume. The code is public on GitHub.
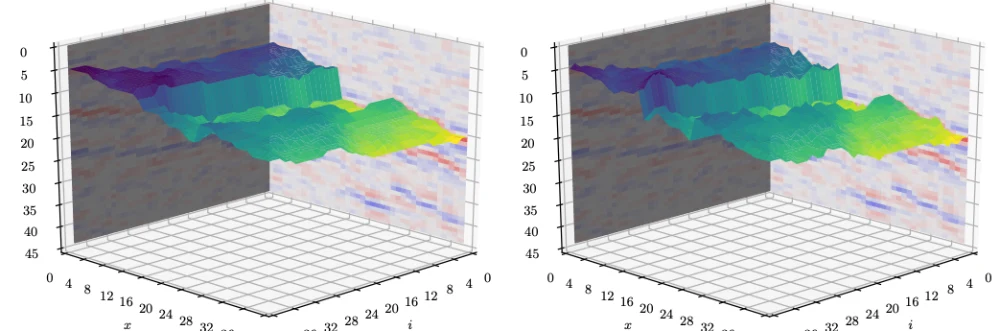
From the thesis: a predicted horizon on the left, the true one on the right.